


Data visualization is a powerful tool in public health, particularly as healthcare systems become increasingly complex and data-driven. With advanced technologies like Power BI and R, public health professionals can now transform raw data into actionable insights that drive better decision-making.
These tools do more than just present numbers; they help stakeholders understand trends, identify gaps, and make timely interventions.
As someone deeply involved in health data management–especially with other large-scale health information systems – I have seen firsthand how effective data visualization enhances decision-making. The ability to present data in a clear, compelling way is critical, and Power BI and R provide the necessary tools to achieve this with precision and efficiency.
The Shift from Static Reports to Interactive Dashboards
Public health has always relied on data, but the way we present it has evolved. Gone are the days of static spreadsheets and text-heavy reports. Today, data visualization enables public health teams to convey insights more effectively, ensuring that key information is both accessible and actionable.
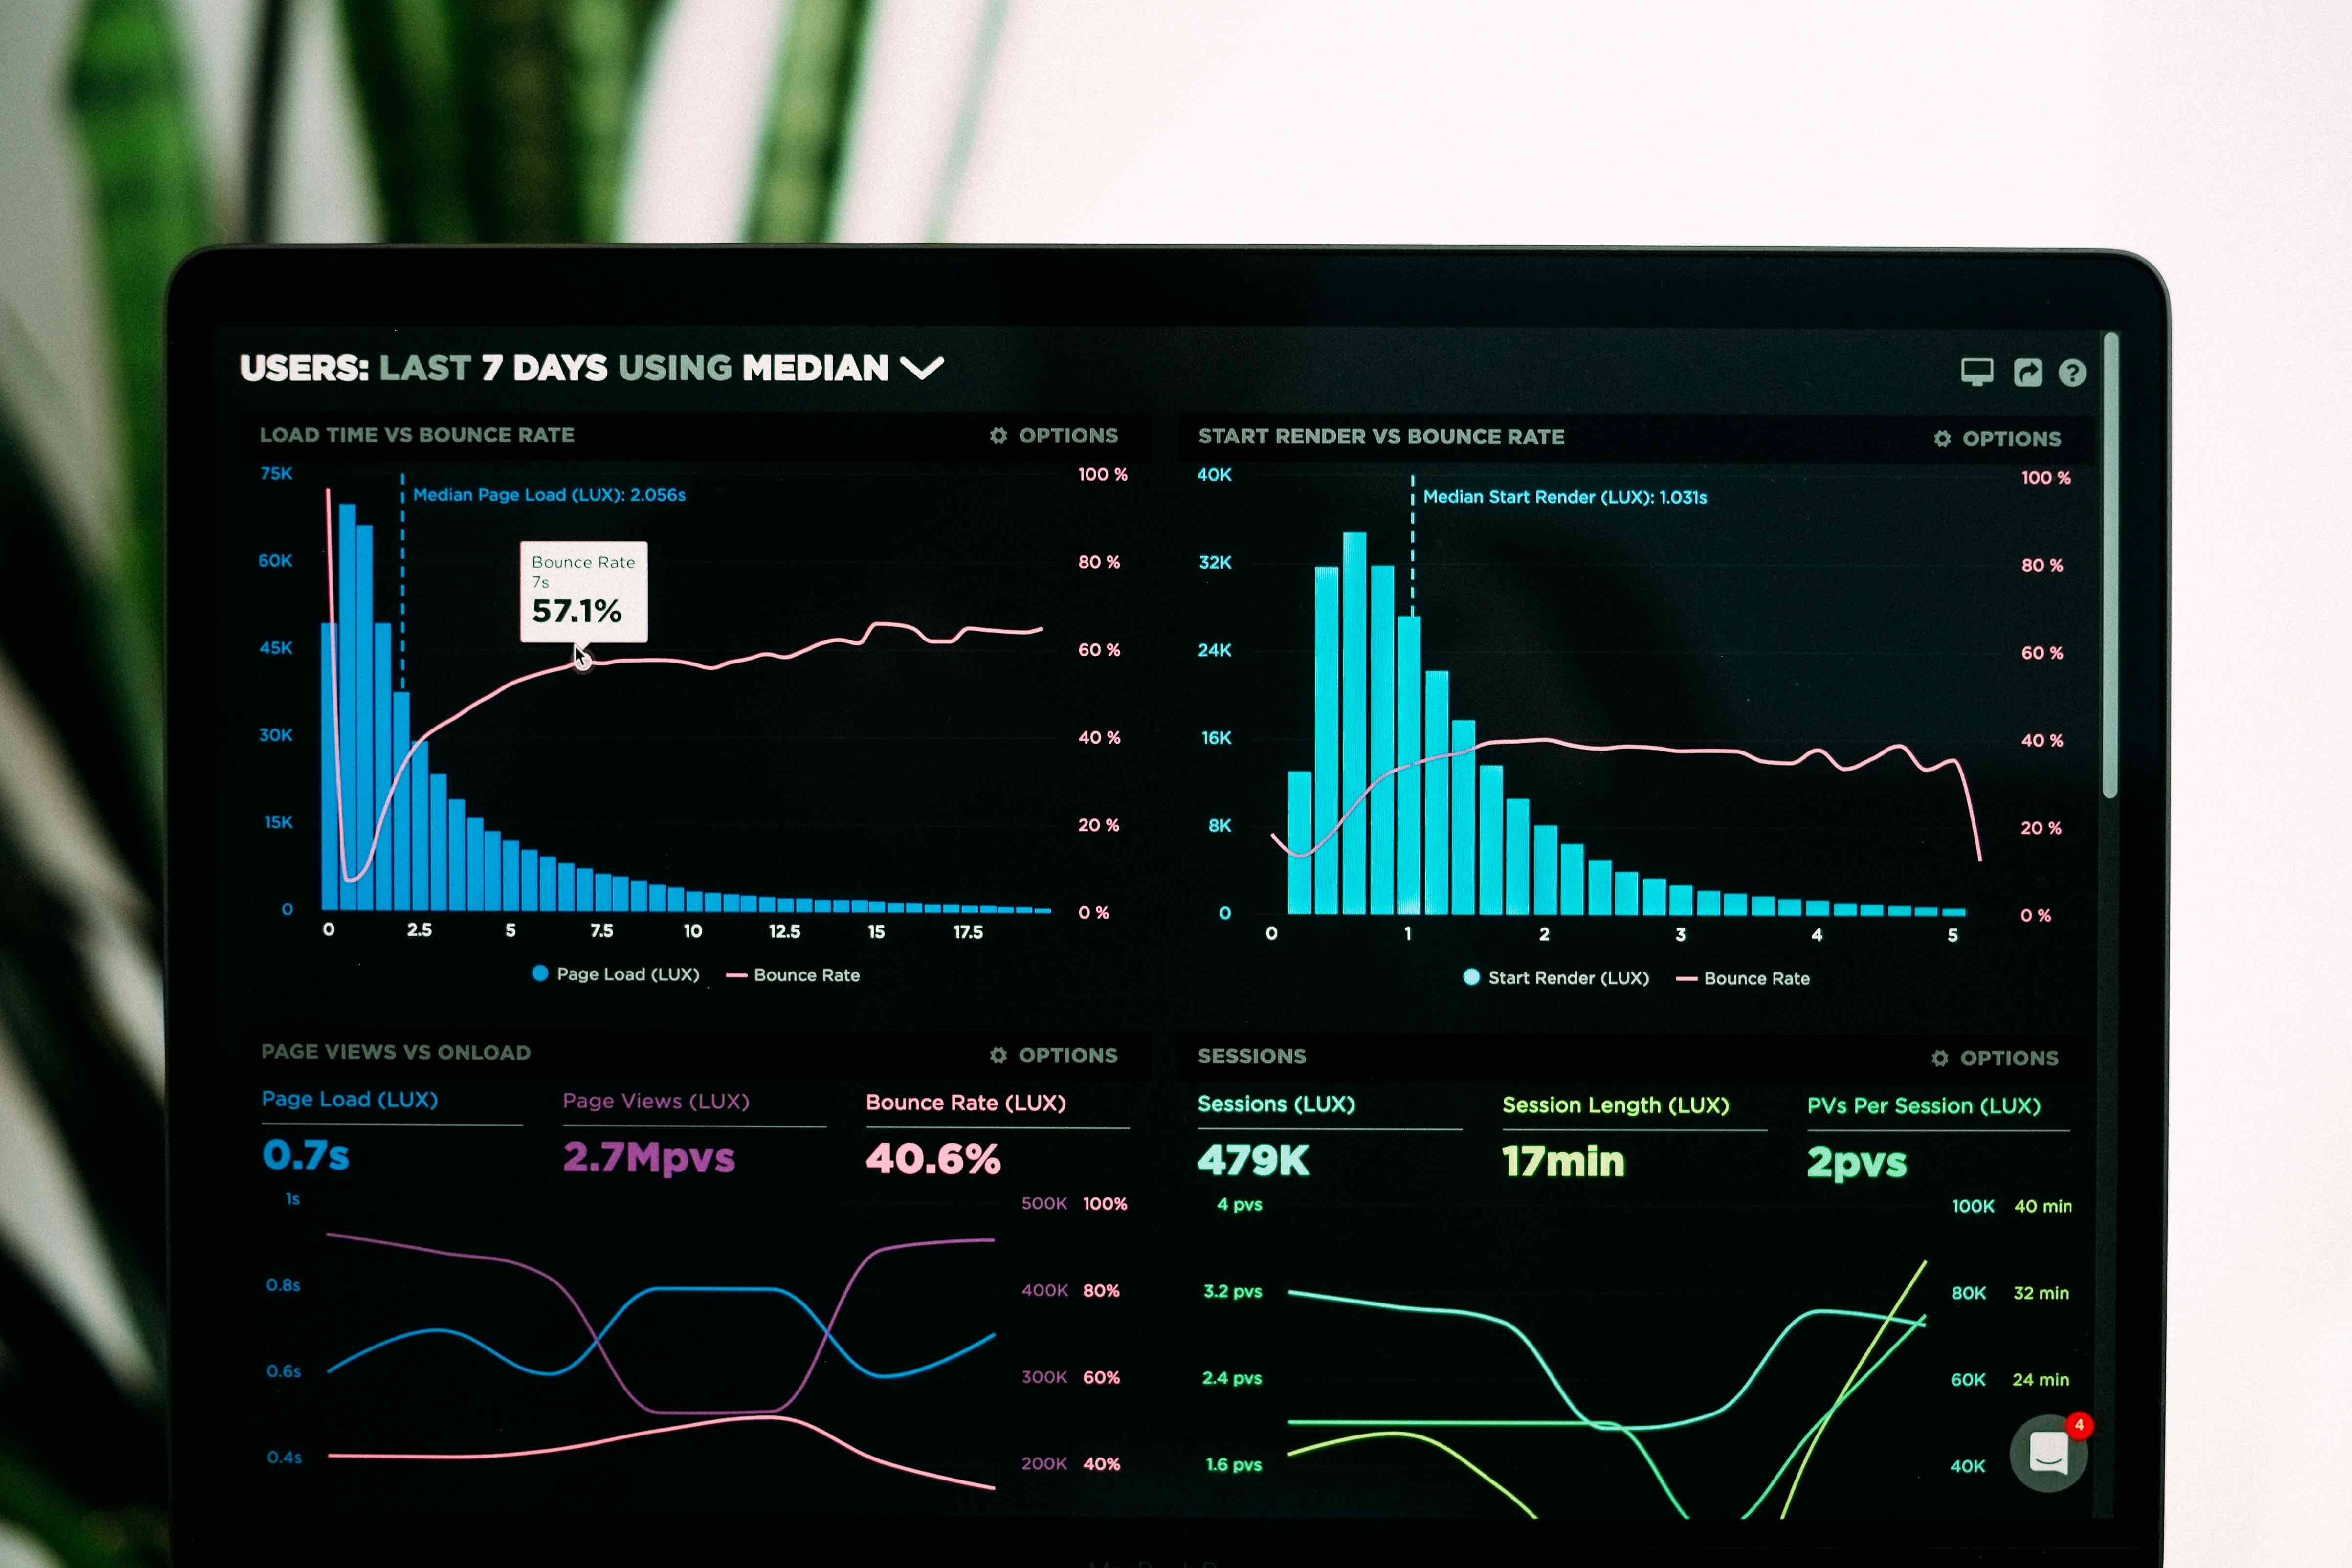
Power BI has been a game-changer in this regard. In my experience working on large-scale health programs – such as HIV/AIDS monitoring – Power BI has enabled teams to translate complex datasets into intuitive visuals that facilitate quick decision-making.
Whether it’s a basic bar chart displaying clinic performance or a more complex scatter plot analyzing adherence trends, the ability to visualize data in real-time allows program managers to respond swiftly to emerging challenges.
A key strength of Power BI is its ability to integrate multiple data sources into a unified dashboard. Public health programs often involve data from various sources, such as hospital records, community surveys, national databases, and donor reports. Manually consolidating this information can be overwhelming, but Power BI automates the process, allowing users to merge datasets from Excel, cloud platforms, and relational databases.
This integration is crucial for programs spanning multiple regions. For example, in tracking HIV patients across hundreds of facilities, having a single, real-time dashboard simplifies patient monitoring and ensures that interventions are data-driven.
Enhancing Decision-Making with Interactive Reports
Another major advantage of Power BI is its interactive functionality, Unlike traditional reports that provide static summaries, Power BI dashboards allow users to:

- Drill down into specific data points
- Filter results by location, demographics, or periods
- Track trends in real-time
This hands-on approach ensures that decision-makers can explore the data dynamically rather than relying on pre-set summaries. For example, if a sudden drop in HIV treatment adherence is detected in a specific facility, program managers can quickly investigate the root cause – whether it’s stockouts of antiretroviral drugs, staffing issues, or patient education gaps – and implement targeted solutions.
The ability to interact with data in real-time provides unparalleled flexibility, making it easier to allocate resources effectively and adjust strategies based on emerging trends.
Where R Excels: Advanced Analysis for Predictive Insights
While Power BI is exceptional for visualizing and presenting data, R is indispensable when it comes to deep analysis and predictive modelling. In public health, statistical analysis is crucial, especially for tasks like:
- Identifying disease outbreaks
- Analyzing patient survival rates
- Predicting treatment adherence patterns
For those of us working in health data analytics, R provides the advanced analytical capabilities needed to move beyond visualization and extract actionable insights.

A major advantage of R is its extensive collection of statistical packages. For instance, when working with large patient datasets, R allows analysts to conduct:
- Survival analysis to track long-term patient outcomes
- Regression modelling to identify factors affecting disease progression
- Time series forecasting to predict future health trends
These analyses uncover patterns not immediately visible in charts, yet they are critical for designing effective public health interventions.
Read also: The Future of Data Documentation: Trends and Emerging Technologies
Predictive Analytics: Anticipating and Preventing Health Crises
One of the most powerful applications of R in public health is predictive modeling. Instead of reacting to crises after they happen, predictive analytics allows us to anticipate risks and intervene early.
For example, using R to analyze historical disease data, we can identify early warning signs of potential outbreaks and take preemptive action. If the model predicts a spike in malaria cases in a particular region, public health officials can dispatch medical supplies and healthcare workers in advance, preventing widespread infection.
Predictive analytics transforms public health from being reactive to proactive, ensuring that resources are allocated efficiently and interventions are timely and targeted.
Power BI and R: A Powerful Combination
Rather than seeing Power BI and R as competing tools, it’s important to recognize that they complement each other.
- Power BI is ideal for creating user-friendly, visually compelling dashboards that can be easily interpreted by a wide range of stakeholders – including policymakers, healthcare workers, and donors.
- R, on the other hand, is designed for in-depth statistical analysis and predictive modelling, making it essential for epidemiologists, data analysts, and researchers.

By integrating both tools, public health professionals can not only visualize trends but also conduct rigorous data analysis, ensuring that decisions are rooted in evidence and guided by advanced analytics.
The Future of Public Health is Data-Driven
Viewing public health through a data-driven lens reshapes how we approach healthcare delivery. As health systems continue to evolve, technology will play an even greater role in:
✔ Enhancing real-time monitoring
✔ Improving predictive analytics
✔ Optimizing healthcare resource allocation
Power BI and R have already proven indispensable in transforming raw data into meaningful insights that drive public health decisions. From tracking patient care to forecasting disease patterns, these tools are revolutionizing the way we understand and respond to health challenges.
For public health professionals, mastering data visualization and analytics is no longer optional—it’s essential for building stronger, more resilient health systems that deliver better outcomes for communities worldwide.
Final Thoughts
As someone who has worked extensively with DHIS2 and other public health data platforms, I have seen how the right tools can transform health programs. The combination of Power BI’s interactive dashboards and R’s analytical power provides an unparalleled approach to data-driven decision-making in public health.
Moving forward, investing in these technologies and training health professionals to leverage them effectively will be critical to achieving better health outcomes, greater efficiency, and more impactful public health interventions.
The future of public health lies in harnessing the full potential of data—and Power BI and R are at the forefront of this transformation.
About Author: Adeola Joseph
Adeola Joseph is an experienced Technical Officer with over six years of expertise in transforming public health data systems. He currently manages a database for more than 300,000 patients under Nigeria’s CDC HIV program.

Adeola specializes in data analysis, visualization, and project management. He is certified in Power BI, SQL, and R, and his innovative, data-driven approaches to digital health have enhanced decision-making that positively impacts case-finding efforts and streamlines data processes.
Additionally, Adeola has presented his insights at international forums, such as the OpenMRS conference and the national NDR boot camp, demonstrating his proficiency in data-driven public health strategies.
